The following is a summary of the day-to-day newly reported data on cases, deaths, and tests in Connecticut. It is important to note that these newly reported updates include data that occurred over the last several days to a week. All data in this report are preliminary, and data for previous dates will be updated as new reports are received and data errors are corrected.
|
Overall Summary |
Statewide Total (includes confirmed and probable cases) |
Change Since Yesterday |
|
COVID-19 Cases |
62,830 |
+802 |
|
COVID-19-Associated Deaths |
4,542 |
+2 |
|
Patients Currently Hospitalized with COVID-19 |
184 |
-7 |
|
COVID-19 PCR Tests Reported |
1,965,112 |
+33,048 |
County-by-county breakdown:
|
County |
COVID-19 Cases |
COVID-19 Deaths |
COVID-19 Hospitalizations |
||
|
Confirmed |
Probable |
Confirmed |
Probable |
||
|
Fairfield County |
20,503 |
865 |
1,113 |
314 |
48 |
|
Hartford County |
15,551 |
722 |
1,123 |
322 |
54 |
|
Litchfield County |
1,900 |
91 |
122 |
21 |
0 |
|
Middlesex County |
1,681 |
73 |
155 |
39 |
4 |
|
New Haven County |
14,904 |
551 |
962 |
157 |
49 |
|
New London County |
2,994 |
89 |
98 |
32 |
23 |
|
Tolland County |
1,453 |
112 |
52 |
15 |
1 |
|
Windham County
|
1,201 |
15 |
16 |
1 |
5 |
|
Pending address validation |
122 |
3 |
0 |
0 |
0 |
|
Total |
60,309 |
2,521 |
3,641 |
901 |
184 |
For several additional graphs and tables containing more data, including a list of cases in every municipality, visit ct.gov/coronavirus and click the link that is labeled, “COVID-19 Data Tracker.”
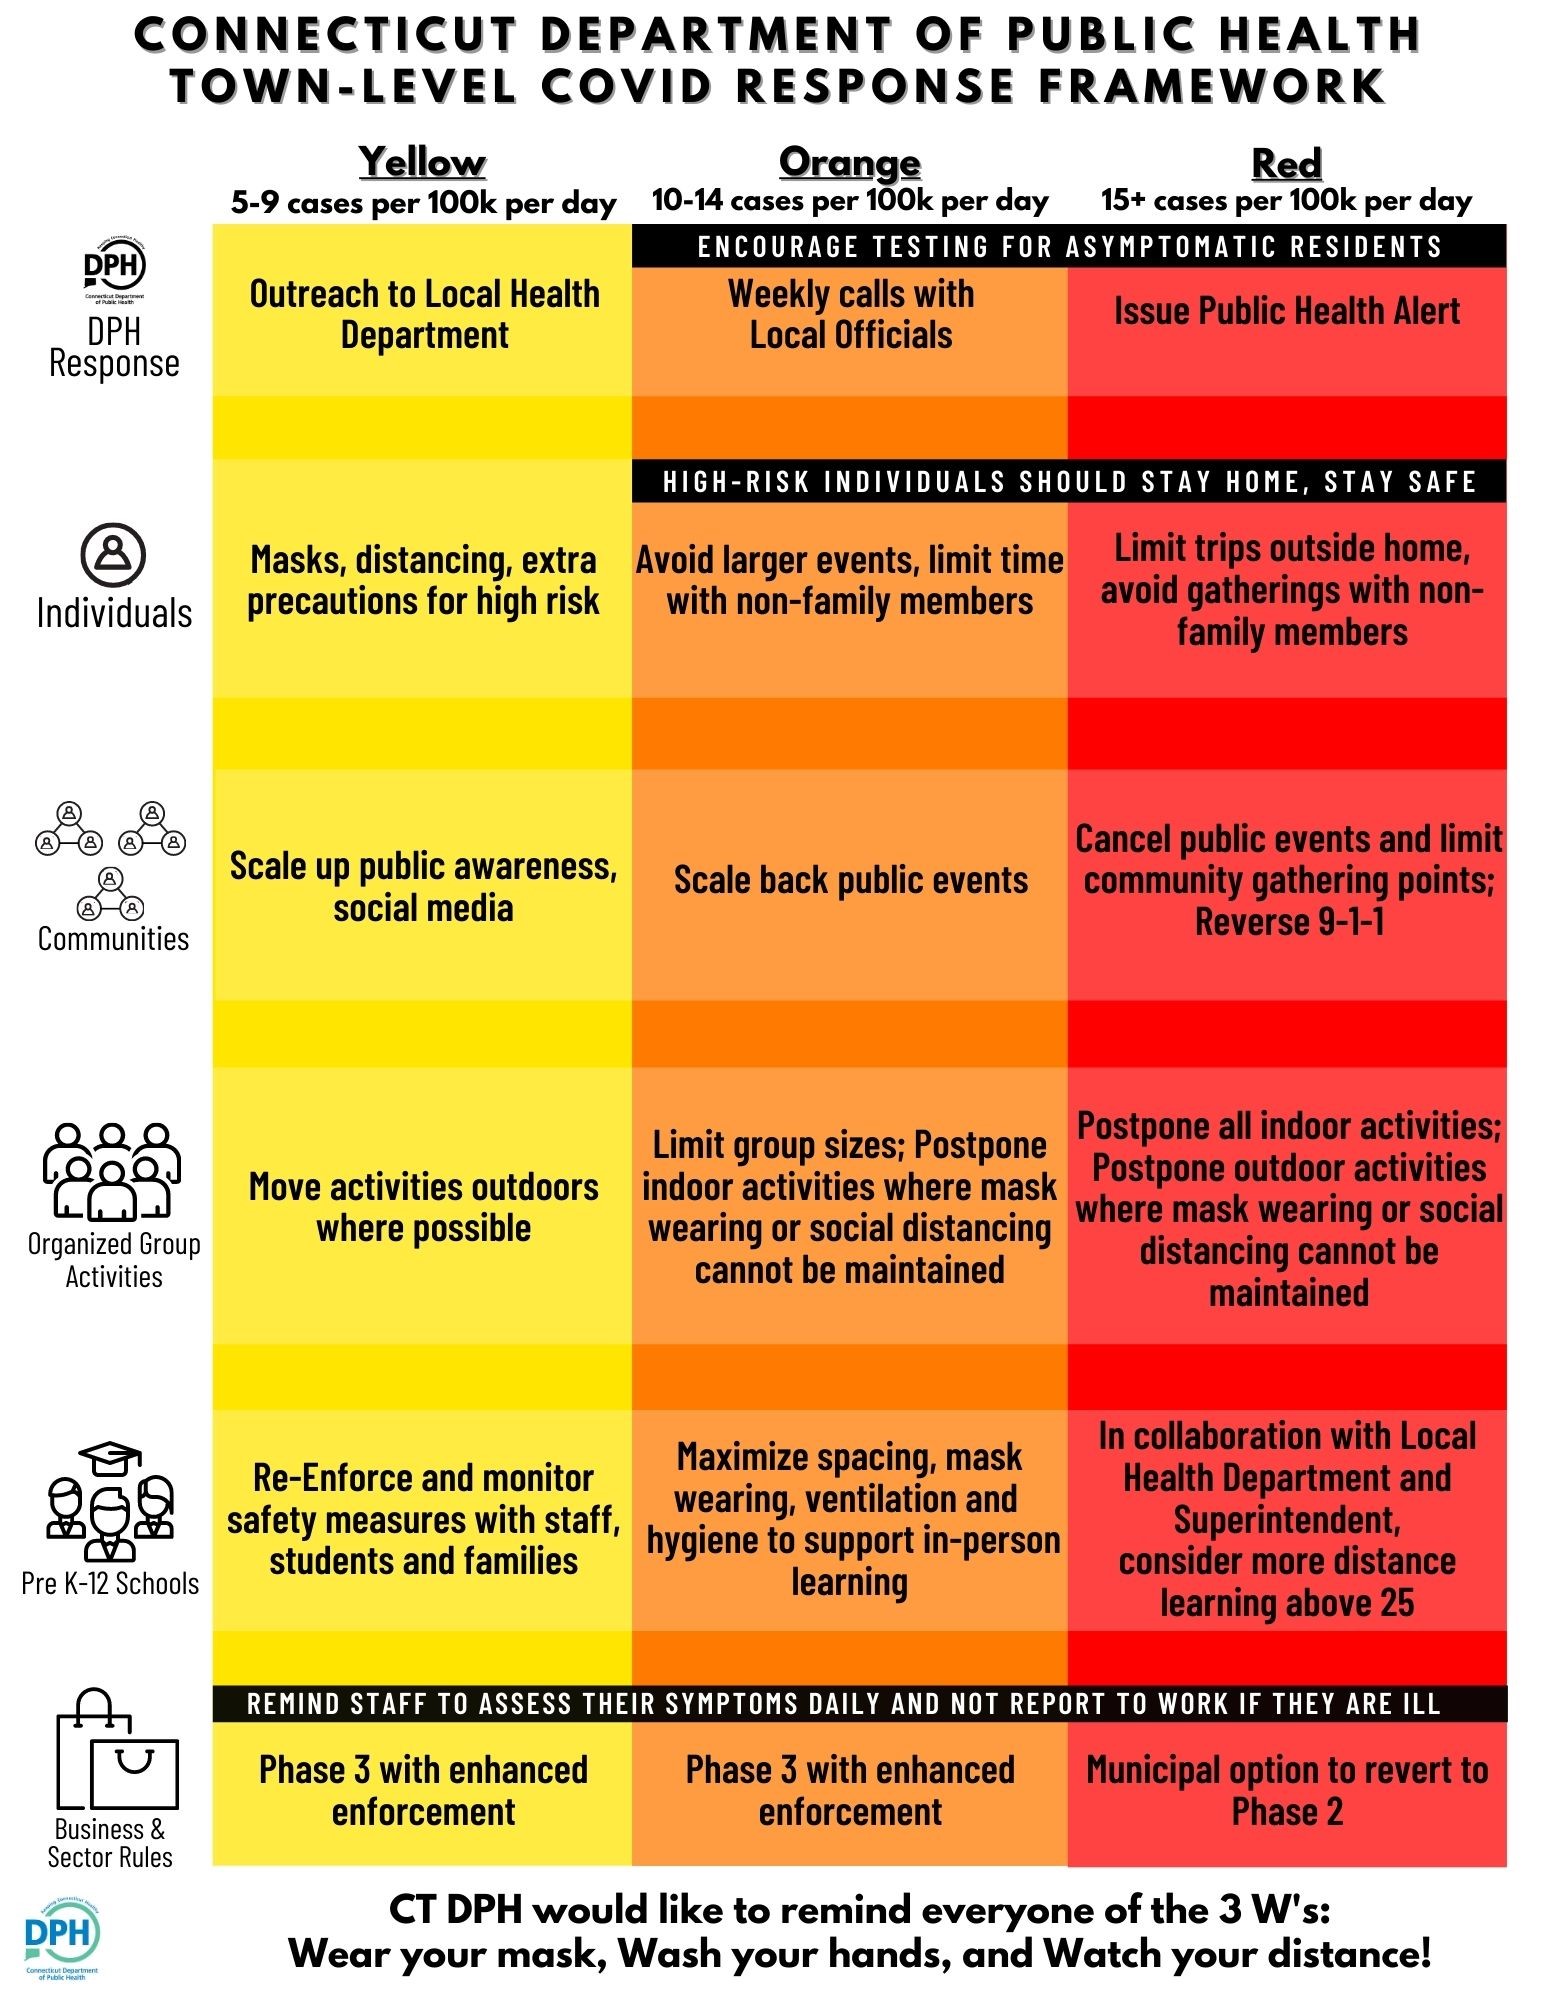
State of Connecticut launches color-coded, weekly COVID-19 alert map with guidance for municipal response
The Connecticut Department of Public Health today launched a new weekly, color-coded COVID-19 alert map for every city and town in the state, identifying the average daily case rate per 100,000 population over the last two weeks. The new weekly alert level is also accompanied by municipal-level guidance on recommended actions for individual residents, institutions such as schools, houses of worship, community organizations, municipal leaders, and local health directors.
The map will be updated every week and is available in the Data Tracker on the state’s coronavirus website (ct.gov/coronavirus).
It is color coded according to the following criteria:
· Red is for municipalities that have a two week average daily COVID-19 case rate higher than 15 per 100,000 population.
· Orange is for municipalities with case rates between 10-14 per 100,000 population.
· Yellow is for municipalities with case rates between 5-9 per 100,000 population.
· Gray is for municipalities with case rates lower than 5 per 100,000 population.
This week, the following municipalities are in the red category:
· Canterbury
· Danbury
· East Lyme
· Griswold
· Hartford
· Montville
· New London
· Norwich
· Preston
· Sprague
· Windham